A Picture is Worth a Thousand Words
Examining learners’ illustrations to understand Attitudes towards
Mathematics
Farhat Syyeda, University of Leicester
Abstract
This
article presents my experience of using pictures/images drawn by children as a
form of data in research and discusses the merits and implications of employing
this method. It comes from research of a mixed method exploratory case study to
investigate the attitudes of 11 and 15 year old secondary school students (in
the East Midlands) towards Mathematics. The aim of this research was to gain an
insight into the emotions, cognition, beliefs and behaviour of learners
regarding Maths and the factors which influence their attitude. Besides using
the tried and tested data collection tools such as focus groups and
questionnaires, the children were asked to draw pictures illustrating their
vision of Maths and its impact on their lives. The idea was to offer them an
alternative medium of communication to exhibit their feelings and thoughts.
Students used emoticons, numerals, figures, characters and mathematical symbols
to show their favourable/unfavourable attitudes towards Maths and their
understanding of the importance of Maths in future life. The results of visual
data in this study conform to the findings of the other forms of data collected
and show that boys and higher ability students have a more positive attitude
towards Mathematics as compared to girls and low ability students.
Key
Words: visual data, images/drawings, case study, attitudes, affect, cognition
Introduction
This article is a part of a larger
study to understand learners’ attitudes towards Mathematics and to investigate
whether attitudes are related to age, gender, academic attainment level, socio
economic status or linguistic background of the learners. The visual data
presented in this article was used in combination with other forms of data to
draw conclusions for the study. The purpose of this article, however, is to
analyse the use of children’s drawings as a form of data in research and to
discuss the merits and implications of using this instrument. The participants of this mixed method
exploratory case study were year 7 and year 10 students belonging to diverse
linguistic back grounds, socio economic status and attainment levels in Maths.
This article comprises of two main sections: the first section examines
relevant literature about the use of drawings as data in detail, whereas the
second section discusses my experience of using visual data to study attitudes
towards Maths.
It is vital to regard students’
opinion in educational research in order to comprehend their perspective and
preferences. The UN convention on the rights of the child (1989) emphasizes the
inclusion of children’s voice in matters concerning their lives. DfES (2001)
also encourages students’ participation in decisions about their learning.
Collecting data from children is a formidable task as some of them are not
comfortable in conveying their opinion in words (speech or written form) due to
lack of confidence, limited vocabulary, learning difficulties, poor spellings
or weak written and verbal expression. Thus their viewpoint may remain unrepresented and unknown. In this research an
innovative method was employed to address this problem and visual data sketched
by the participants in the form of pictures/images/drawings was gathered.
Visual
data in research
An image/visual/picture is a nonverbal
mode of expression worldwide and provides an alternative and complementary tool
of communication. Drawing is a popular and engaging activity among children all
over the world which can be employed to elicit useful data in a fun and affable
way unlike questionnaires which may create test like situation and cause
anxiety (Bekhit et al., 2005). It’s a quick and efficient method to collect a large
amount of data (MacPhail & Kinchin, 2004) in a short span of time. Drawings
provide a multi-dimensional view of children (Malchiodi, 1998) and offer a
unique way of discovering their perceptions. Through their drawings children
may portray their feelings and emotions, their knowledge and understanding,
their vision of the world around them and their experiences. They draw what they see (visual realism) and
what they know (intellectual realism) (Cox, 2005).
The greatest advantage of drawings is
that they are child centred (Merriman & Guerin, 2012) and child empowering.
Children can draw whatever they wish to share and whatever they consider
important without any prompting or instruction (Einarsdottir, 2009). Since
drawing is a universal language, it can be used as a data collection tool among
children from different countries and cultural back grounds; avoiding the
hassle of translation between languages and interpretation of transcripts.
Drawings have been successfully used to extract data from street children
belonging to deprived families in India who have never been to school and
cannot read or write (Merriman & Guerin, 2012).
Drawings are commonly used in research
in clinical psychology to collect information about a range of psychological
and emotional aspects in children including personality traits, mental
development and neurological disorders (Thomas and Jolly, 1998; Bekhit et al,
2005). In the field of Education, drawings have been used to explore children’s
attitudes towards different subjects taught at school (Smith, 2011; MacPhail &
Kinchin, 2004), national identity (Durrani, 2008) and perceptions and
experiences about being at school (Einarsdottir et al, 2009).
Despite all the advantages, pictures
drawn by children are very complicated and should be used as data with caution.
Burkitt (2004) observes a link between the vision and attitude of a child and
the size of figure that he/she draws.
Large size normally depicts a happy, positive, socially important and
pleasing figure. However, it does not imply that a smaller figure means a negative
image. Also, a child’s sense of proportion and skills as an artist can affect
the size and scale of the picture/drawing (MacPhail & Kinchin, 2004).
Colours are quite often associated
with moods and emotions. Bright, bold colours like red, yellow and orange are
normally viewed as cheerful and positive whereas dark colours such as purple,
black and brown are presumed to show distress. Nevertheless, the selection of
colours can be related to personal liking or feeling towards a particular
colour and may have nothing to do with a jovial or gloomy image (Burkitt et al.,
2003).
Children may express their feelings,
emotions and attitudes in their drawings; however they may not be depicted in a
consistent and reliable way (Burkitt, 2004). Children belonging to different
cultures and educational backgrounds may use the same colour or image to
represent contrasting meanings. Therefore it is not advisable to use drawings
as ‘sole indicators’ of children’s emotions as they can be interpreted in
numerous ways (Thomas and Jolley, 1998).
‘A child psychologist once
scoffed at the notion proposed by some that the children at Bellevue painted
boats on the water because it symbolised the separation from their mothers,
making the point with some scorn that they drew boats because the hospital was
on the East River and that was all they saw!’
(Rubin, 1984: 45) quoted in Merriman & Guerin, (2012).
Because of the challenges in
interpretation and analysis, pictures are not a very reliable instrument for
gathering data. To understand the drawings they can be used in combination with
other tools for example follow up interviews with the illustrators asking them
to talk through (Einarsdottir et al., 2009) and interpret their drawings, but
it may be more time consuming. Children can also be asked to annotate or label
the drawing to make their meaning clearer. Some researchers observe and listen
to the children while they are drawing (Cox, 2005) to understand the thought
process going on in their minds.
Recent research recognises the value
of drawings not just as a ‘visual reference’ to real objects but as a
‘constructive process of thinking’ (Cox, 2005: 123) and meaning making which
cannot be understood in isolation from its social and cultural context.
Drawings narrate and communicate children’s understandings and experiences in
their specific contexts; therefore it’s imperative to focus not just on the
image but the message it conveys and the meaning it entails (Einarsdottir et
al, 2009).
Examining
learners’ drawings to study Attitudes towards Maths
The purpose of this research was to
understand attitudes towards Maths among year 7 (KS3) and year 10 (KS4)
students in a major city in the East Midlands and to investigate whether age,
gender, academic attainment, socio economic status or linguistic background had
any impact on attitudes. Attitude is a complex term and for this research it
was defined as a combination of three components namely: Affect (emotional
disposition, belief and vision about the subject), cognition (perception of
usefulness of the subject) and behaviour (intentions, commitment and
performance in the subject).
To select the research participants, a
purposive sampling technique was employed and of the 38 schools listed on The
Department of Education’s website, 13 schools were shortlisted. These 13
schools were further grouped on the basis of the attainment level of students
in GCSE exam, the percentage of students claiming free school meals (FSM) and
the percentage of students with English as a second language (ESL). The plan
was to include four schools in the research however, although all the 13
schools were contacted, only 2 schools agreed to allow access to their students.
To select the students within schools, again a purposive sampling strategy was
adopted and high ability and low ability learners, girls as well as boys and
year 7 and year 10 students were represented.
For this research four kinds of data
were gathered to investigate attitudes towards Maths in two phases. In the
first stage, qualitative data through focus group discussions was collected on
audio tape. Focus groups are interview style group discussions involving a
small number of participants (usually between four and twelve) guided by a
facilitator or moderator (Barbour, 2008). For this research, focus groups were
the most suitable tool for collecting qualitative data because focus groups are
held in an informal atmosphere which encourages the participants to speak
openly and freely about attitudes, opinions and behaviours. Since the
participants of this research were young students between the age of 11 and 15
years, individual interviews in a formal style would not have been a good
choice. The children could feel intimidated or pressured and concerned about
being evaluated by the interviewer, thus withholding their inner feelings.
However, these effects are diluted in a group setting because the respondents
feel empowered as the burden of answering is distributed (Berg, 2009). For this
research, four focus groups were conducted in two different schools in which
sixteen students participated. Data collected through focus groups was also
used as a stimulus to design the questionnaire.
Focus groups generate a good amount of
data in a short span of time but give a collective view of the participants.
Therefore, to get an insight into the perceptions, personal feelings and
thoughts of the students individually, the second phase of the research
consisted of anonymous questionnaires. The questionnaire was purposely designed
to collect quantitative as well as qualitative data. It contained closed
questions to measure preferences on a Likert scale and open ended items asking
the learners to write a passage or draw a picture about their vision of Maths
and its impact on their lives. The aim was to elucidate maximum data by
providing alternate media of expression to include visual learners and those
who are not fond of extended writing. Keeping in mind the complexities of
interpreting pictures, the children were asked to annotate their illustrations.
Moreover, the researcher remained in the same classroom with them while they
were drawing and asked the artists to describe what they had sketched wherever
possible.
General
findings of the study
The data gathered for this study
indicates that attitudes towards Maths are affected by gender and attainment
level. The Likert scale clearly shows that boys have a more favourable
emotional disposition towards Maths (Mean value µ = 1.76 where 1 is positive
and 3 is negative) as compared to girls with a mean value of 2.19. The
cognitive aspect of attitude is also more positive in boys (µ = 1.26) than
girls (µ=1.5). Similarly high ability learners have a mean value of µ=1.75 for
affect and µ=1.27 for cognition whereas the low ability learners have µ
(affect) = 2.18 and µ (cognition) = 1.49. These differences in means are
statistically significant (t-tests were conducted). Other factors such as age,
socio economic status and linguistic back ground also influence affect and
cognition towards Maths but do not impact them significantly.
Interpreting
images drawn by the participants
A total of 187 students filled in the
questionnaires; however the number of students who chose to draw pictures was much
smaller (about 10%). This indicates that drawing is not a preferred mode of
communication for all the children (Einarsdottir et al., 2009). Some children
used a combination of words and images such as emoticons (smiley and sad faces)
and thumbs up and down signs to demonstrate their favourable or unfavourable
attitudes towards different aspects of maths.
Nevertheless, a few pictures (presented in this article) were more detailed and
depicted the perceptions of learners beautifully.
The images/drawings made by the
learners were interpreted using a holistic approach (MacPhail & Kinchin,
2004) considering the content as well as the context of the drawings and
keeping in mind the theoretical framework of the research. These images were
also shown to other researchers and doctoral students for discussion before
arriving at the following interpretations.
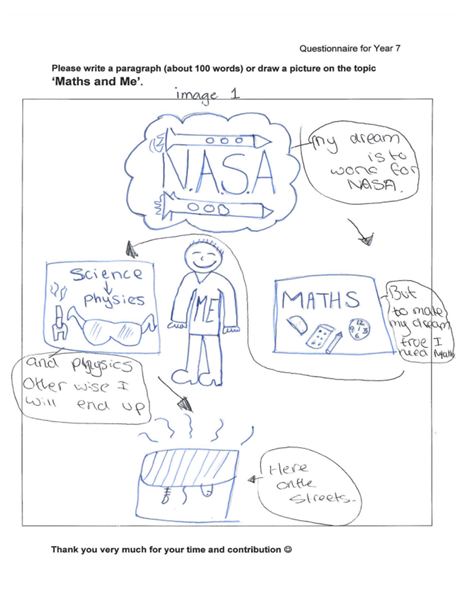
Images 1 and 2 describe the importance
and usefulness of Maths in personal and professional life. These two images are
related to the cognitive component of attitude whereas the emotional aspect is
not mentioned. Image 1 makes the assertion that knowledge of Maths (along with
science) can help this child get his dream job which is to work for NASA but
without Maths he would be useless and
may end up on the street in a bin. The child does not explicitly show his
liking for the subject (other than the big smile) but has a clear understanding
that Maths is important for his career in future.
Fig 1: Image 1
Image 2 highlights that Maths is not
only needed in job and everyday life; it also helps in ‘developing your thinking of the world’. This image also underscores
the importance of Maths (cognitive aspect) but does not express any feelings or
emotion towards the subject.
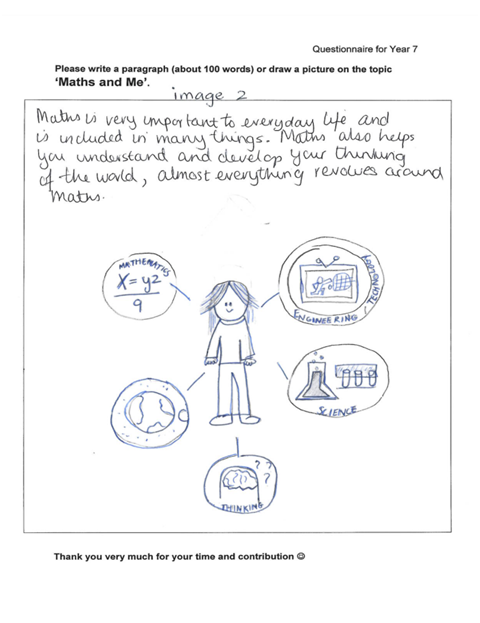
Fig 2: Image 2
The emotional disposition of the learners in a typical classroom setting is depicted in the next three images. In image 3, the scale of the drawing is noteworthy. The actual classroom is diminutive in comparison to the imagination of the child (all images were drawn on A4 sheets). The teacher has a stern expression on her face and the words uttered by her do not convey any meaning to the learner (blah, blah, blah). The child is completely distracted and snoring (zzz).
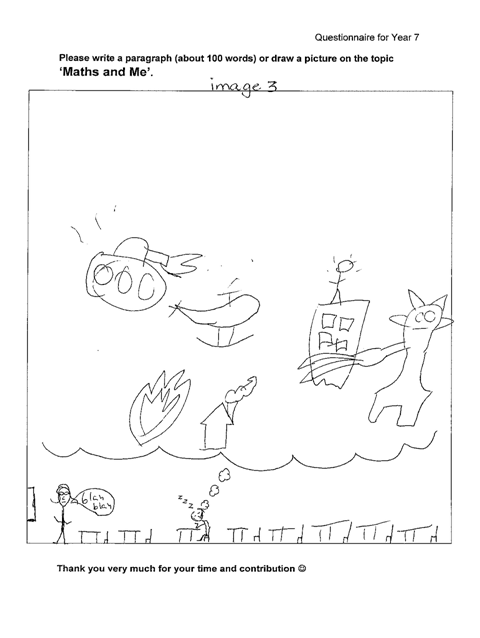
Fig 3: Image 3
Image 4 portrays a lack of connection
between the teacher and the student. The student is unable to follow teacher’s
explanations (blah, blah, blah /what?).
She feels restricted and confined to her seat which seems to be rooted to the
ground (legs of the chair drawn in bold). She is unengaged and bored.
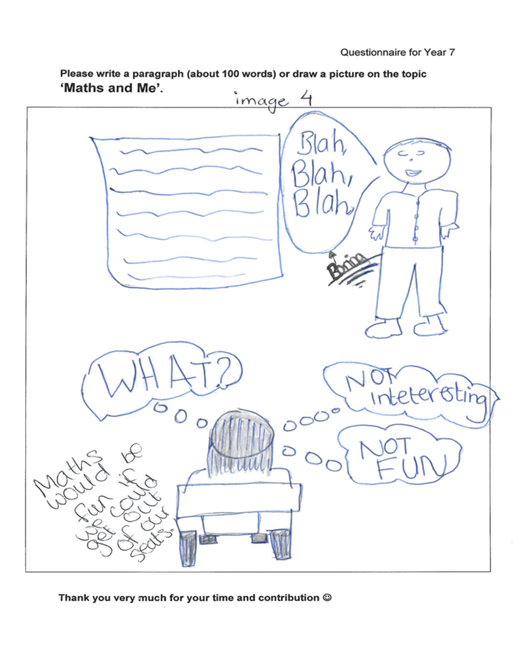
Fig 4: Image
4
Image 5 shows the teacher with a
pleasant countenance (a smiling face) which suggests that the learner has a
positive impression about the teacher. Her words are also not meaningless (5x3=15 makes sense). Nevertheless, the
student seems to be vexed. The learner’s affect towards Maths according to his
Likert scale data is positive or favourable, although he is from the low
ability cohort. Thus the frustration could be due to the lesson being pitched
at a level below his intelligence or the teacher going into too much detail and
explaining the obvious (5X3=15).
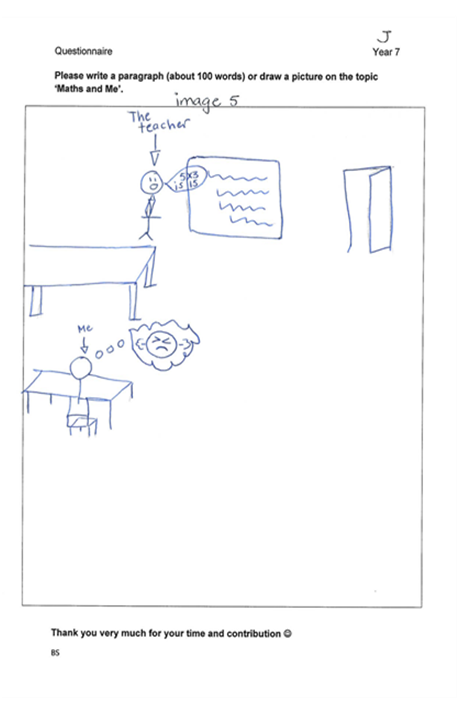
Fig 5: Image 5
Image 6 displays positive emotions
towards Maths (sign of heart <3), however this love for Maths is conditional
upon the teacher being good.
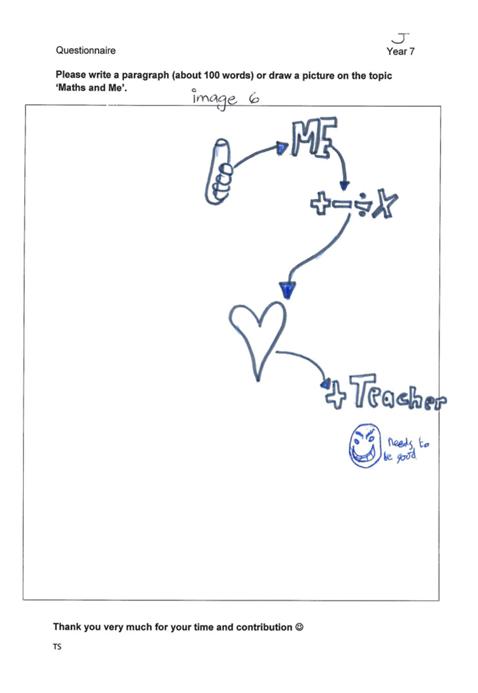
Fig 6: Image 6
Image 8, 9 and 10 are drawn by high
ability year 10 boys and demonstrate a high level of confidence, pride and
self-esteem. Image 8 shows a proud and
jubilant student (Maths equals happiness)
with his Maths book, who feels totally in command to tackle all the
problems/assignments in Maths (strength shown by muscles).
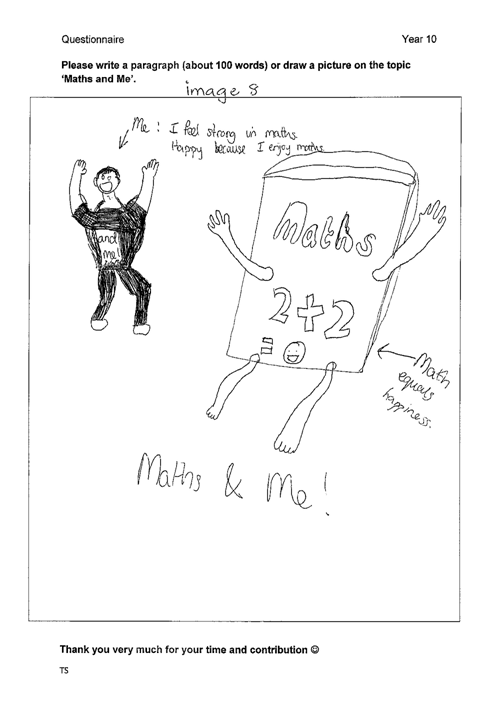
Fig 7: Image 8
Image 9 depicts joy and celebration in
the form of dancing for achieving a hundred percent score in Maths (though
graphs are a weak area and make the student cry).
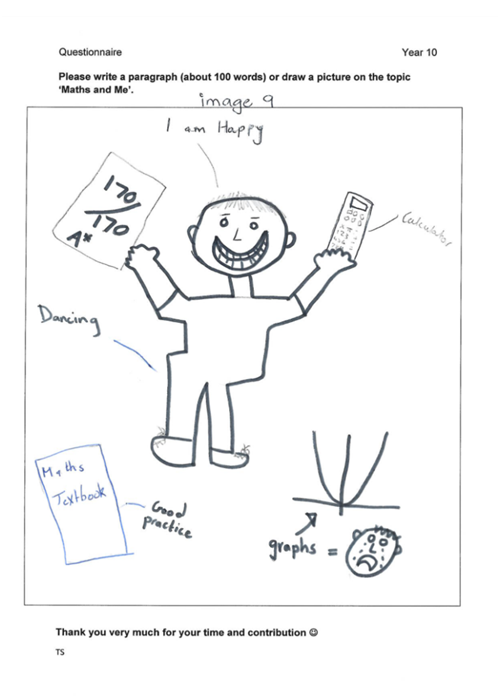
Fig 8: Image 9
Image 10 shows self-contentment and
pride for being the best students in the class and being superior and better in
Maths than everyone else (ME > EVERY1). The students seems to have a
positive self-concept and his positive disposition towards Maths is related to
his achievement (I like Maths because I
am better than everyone else).
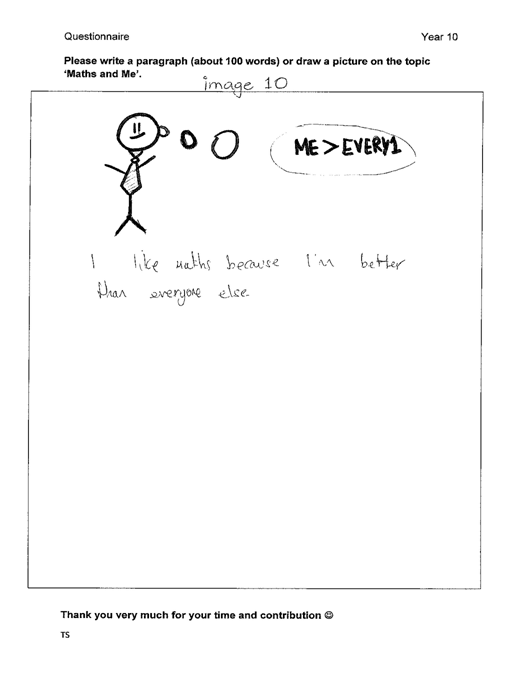
Fig 9: Image 10
Discussions
and Conclusion
The attitudes demonstrated in the
images seem to be in consonance to the trends highlighted through other forms
of data collected for this project. The findings of this research show that
high ability learners and boys have a positive attitude towards Maths which is
statistically significant as compared to low ability learners and girls. Other
factors such as age, socio economic status and linguistic back ground also have
an impact on attitudes but it is statistically insignificant.
It’s interesting to note that less
than 10% of the 187 students who participated in this research chose to express
themselves visually in images/drawings and most of them were boys and high
ability students. In my sample, 75 out of 187 students were girls (about 40%).
However, of the nine images shown here, only two (image 2 & image 4) were
drawn by girls (about 22%); one from the high ability and the other from the
low ability cohort. Similarly, 78 out of 187 (about 42%) students were from the
low ability cohort but only two low ability students, one of them a girl drew
pictures (image 4 & image 5). The contact time allowed with the students in
this research was very short; only twenty five minutes. Thus after completing
the Likert scale questions, students were left with only fifteen minutes to
write a passage or draw an image. This could be a reason for the low response
rate. Pictures are an interesting
medium to study children’s perceptions but unfortunately learners becomes less
enthusiastic about drawing as they grow and move up in school (Anning, 2002).
In my sample more pictures were drawn by year 7 students as compared to those
in year 10. Therefore this instrument is more effective in collecting data from
younger children.
References
Anning,
A. (2002), ‘Conversations around young children’s drawing: The impact of the
beliefsof significant others at home and school’, Journal of Art and Design Education, 21(3),197–208
A
summary of the UN Convention on the Rights of the Child (1989).http://www.unicef.org.uk/Documents/Publication-pdfs/UNCRC_PRESS200910web.pdf accessed on 22 December, 2014
Barbour,
R. (2008), Introducing Qualitative
Research: A Student's Guide to the Craft
of Doing Qualitative Research, UK:
Open University Press.
Bekhit,
N. S, Thomas, G. V. & Jolley, R. P. (2005), ‘The use of drawing for
psychological assessment in Britain: Survey findings’, Psychology and Psychotherapy: Theory, Research and Practice, 78,
205–217
Berg,
B. L. (2009), Qualitative Research
Methods: For the Social Science, Boston: Pearson Education Inc.
Burkitt,
E., Barrett, M. & Davis, A. (2003b), ’The effect of affective
characterisations on the use of colour within children’s drawings’, Journal of Child Psychology and Psychiatry,
44, 445–455.
Burkitt,
E. (2004), ‘Drawing conclusions from children’s art’, The Psychologist, 17, 566-568.
Carey,
M. (2011), The social work dissertation:
Using Small-Scale Qualitative Methodology, New York: Open University Press
Cox,
S. (2005), ‘Intention and Meaning in Young Children’s Drawing’, International Journal of Art & Design
Education, 24(2), 115–125
Durrani,
N. (2008), ‘Schooling the ‘other’: the representation of gender and national
identities in Pakistani curriculum texts’,
A Journal of Comparative and
International Education, 38:5, 595-610
Einarsdottir,
J., Dockett, S. & Perry, B. (2009), ‘Making meaning: children’s
perspectives expressed through drawings’, Early
Child Development and Care, 179:2, 217-232
Henderson,
N.R. (1995), ‘A practical approach to analysing and reporting focus groups studies:
lessons from qualitative market research’, Qualitative
Health Research 5, 463-477
MacPhail,
A. & Kinchin, G. (2004), ‘The use of drawings as an evaluative tool:
students' experiences of sport education’, Physical
Education and Sport Pedagogy. Available at:
http://dx.doi.org/10.1080/1740898042000208142 Accessed on 15 October, 2014.
Malchiodi,
C. (1998), Understanding Children’s
Drawings, New York: The Guilford Press
Merriman,
B. & Guerin, S. (2012), ‘Using Children’s Drawings as Data in Child-Centred
Research’, The Irish Journal of
Psychology, 27 (1-2), 48-57.
Sim,
J. (1998), ‘Collecting and analysing qualitative data: issues raised by the
focus group’, Journal of Advanced Nursing,
28(2), 345-352
Smith,
C. (2011). Proceedings of the British Society for Research into Learning
Mathematics (Ed.) 31(1) Available at: www.bsrlm.org.uk Accessed on 6 June, 2014
Thomas,
G. V. &Jolley, R. P. (1998), ‘Drawing conclusions: a re-examination of
drawings’, Journal of Clinical Psychology,
37, 127–139.